Why should safety officers use Multiple HSE Reporting Dashboards?
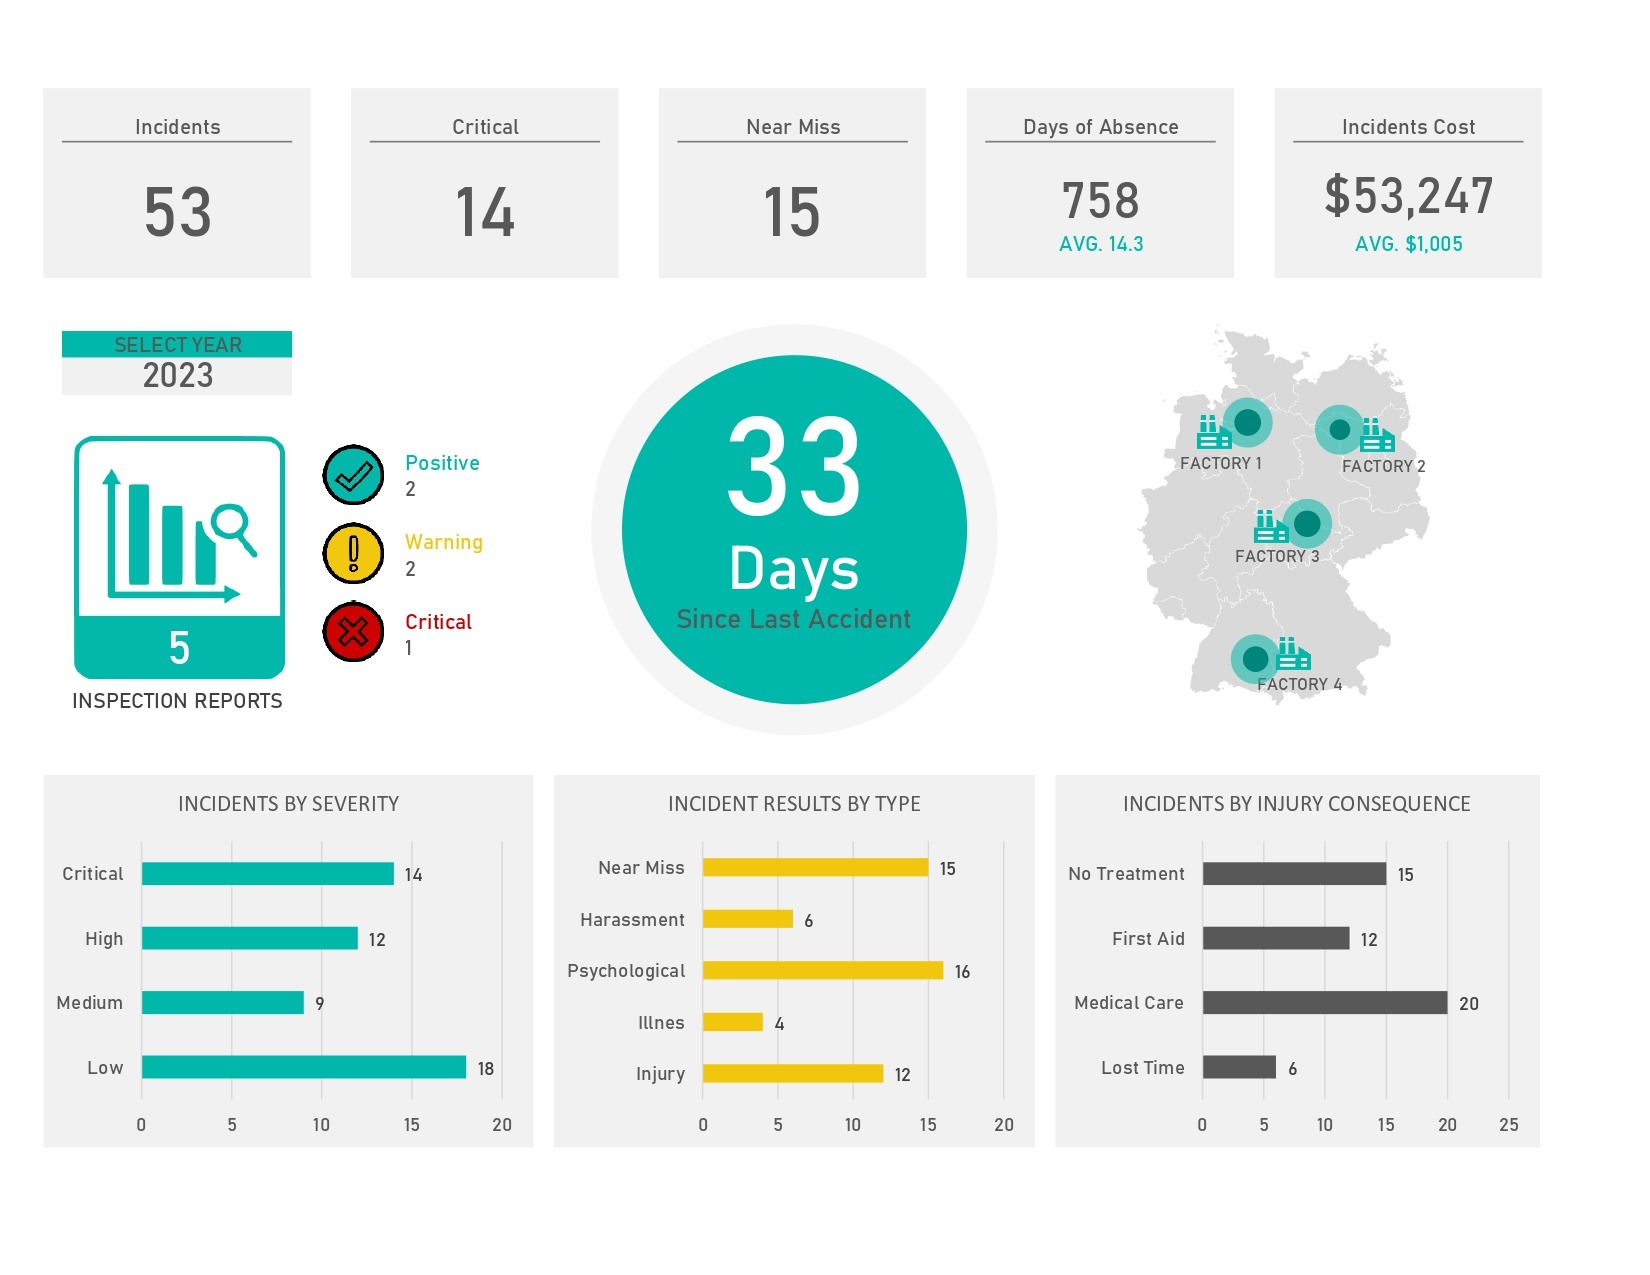
Multiple HSE Reporting Dashboards make it easier to track incidents, inspections, training, and other safety metrics in one place. These dashboards help safety officers visualize performance trends, identify gaps quickly, and take action before risks escalate.
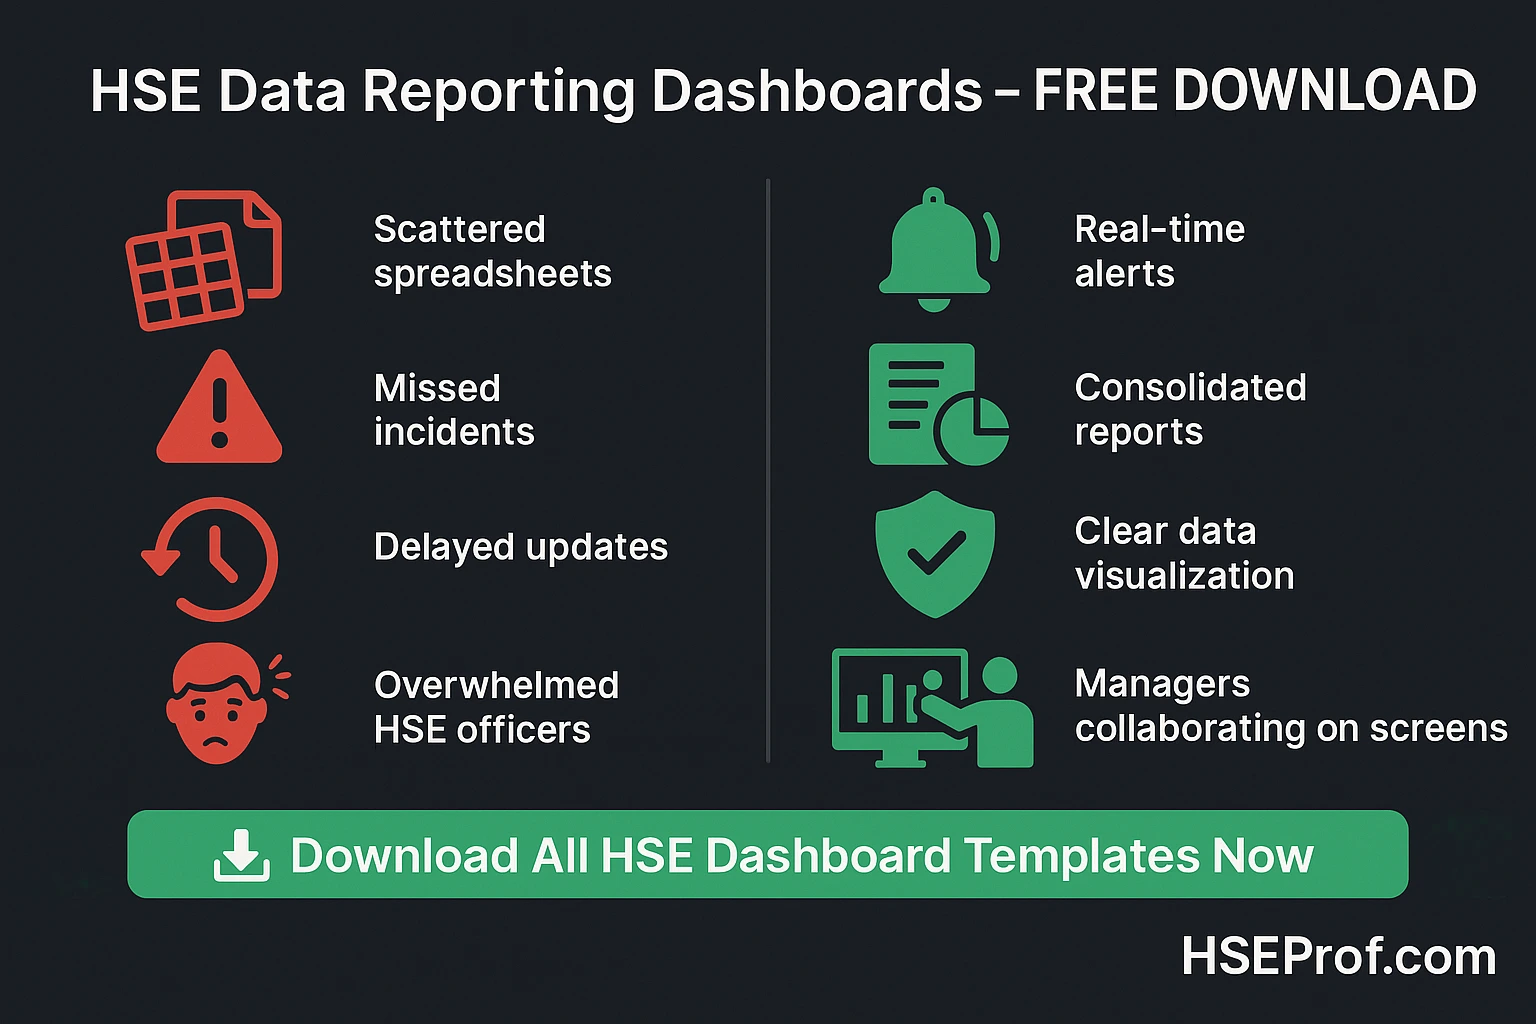
In many organizations, HSE data is scattered across spreadsheets, emails, and reports. This can lead to missed insights and delayed corrective actions. Dashboards solve this by consolidating data and displaying it in real time. With pre-built templates, HSE professionals no longer need to spend hours designing charts or compiling reports manually.
How can Multiple HSE Reporting Dashboards improve compliance and decision-making?
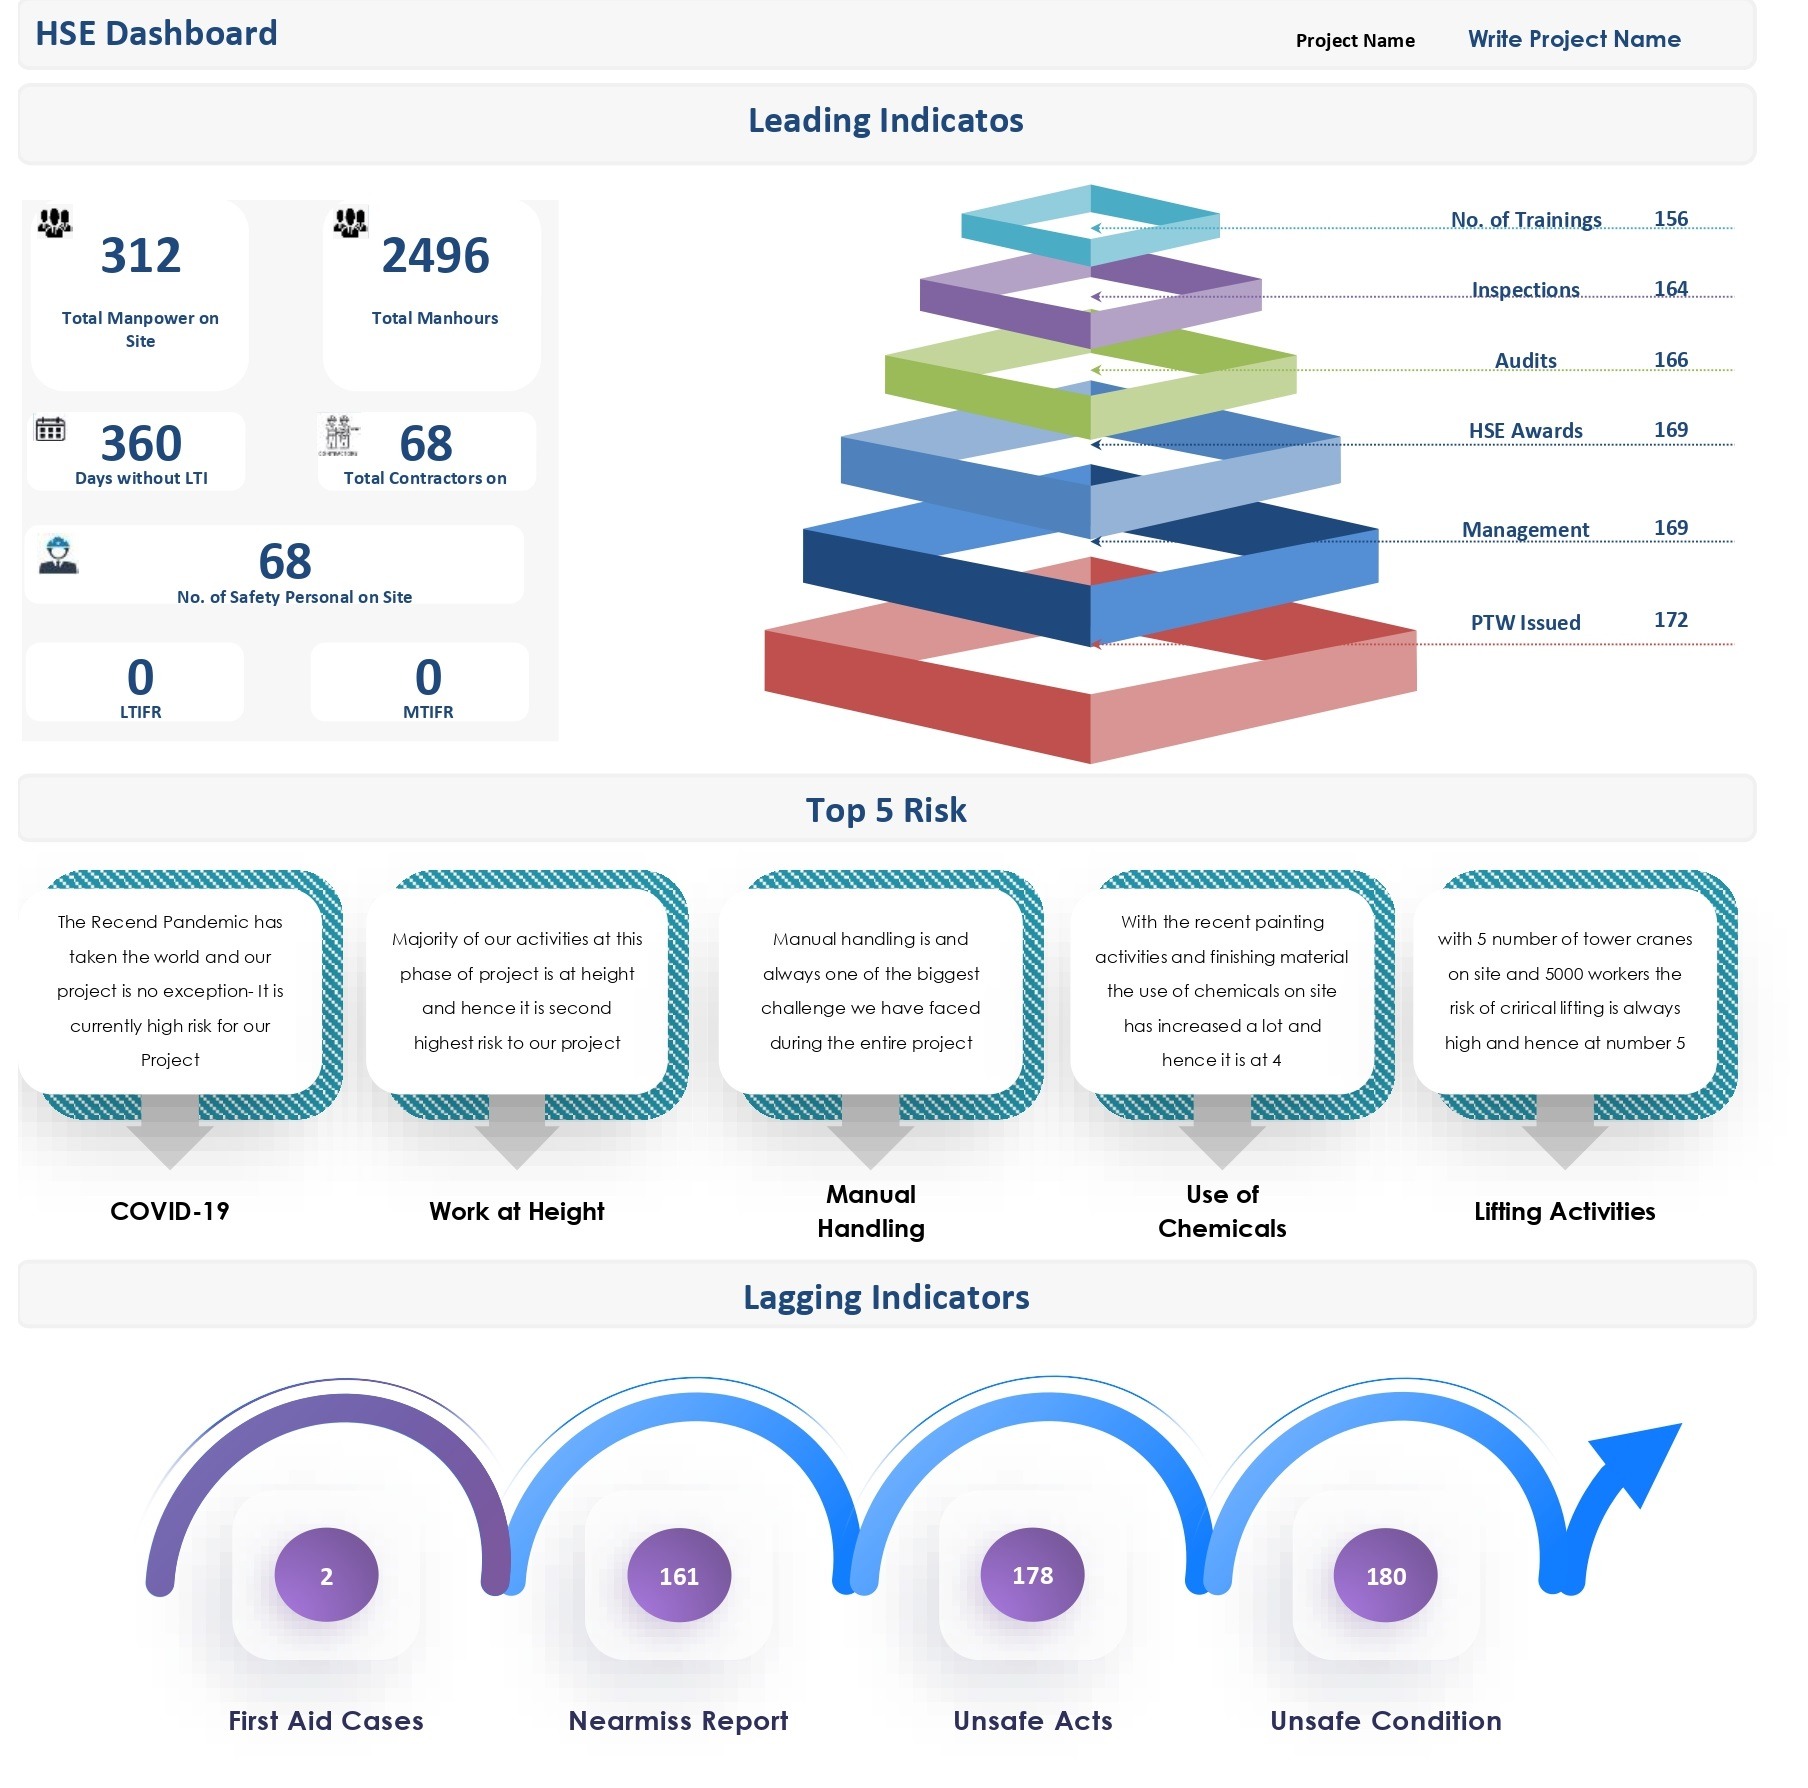
Dashboards provide a single source of truth for all key safety metrics, which enhances both compliance and decision-making. They allow management to see exactly where the organization stands in terms of incidents, audits, leading indicators, and regulatory compliance.
Some key benefits include:
- Instant visibility: Dashboards highlight safety trends and leading indicators before they become major problems.
- Custom KPIs: Users can track performance indicators specific to their industry and region.
- Audit readiness: Centralized data makes it easier to demonstrate compliance during inspections.
- Improved reporting: Stakeholders receive clear, visual reports without waiting for monthly summaries.
Many dashboards also include features such as automated incident categorization, root cause analysis charts, and training compliance tracking. These tools empower safety officers to act quickly and provide evidence-based recommendations.
What’s included in the free dashboard pack?
The downloadable pack contains Multiple HSE Reporting Dashboards in Excel format. Each dashboard is fully editable and includes pre-configured charts and KPIs for:
- Incident and near-miss tracking
- Audit and inspection results
- Corrective actions and closure rates
- Training completion and certification status
- Project-specific safety performance
All templates are compatible with Microsoft Excel and Google Sheets. Each file is branded with “Download HSE Docs from hsedocspro.com” and comes with user instructions for customization.
Why should you download these dashboards today?
Whether you manage safety across construction sites, oil & gas facilities, or corporate offices, these dashboards help you stay compliant and improve performance. They provide a clear view of where you are excelling and where you need to focus more resources.
Safety officers who have implemented dashboards report faster decision-making, better engagement from management, and fewer audit findings. By downloading these dashboards, you can immediately start streamlining your reporting process and driving a stronger safety culture.
Download from the Below as your Requirements
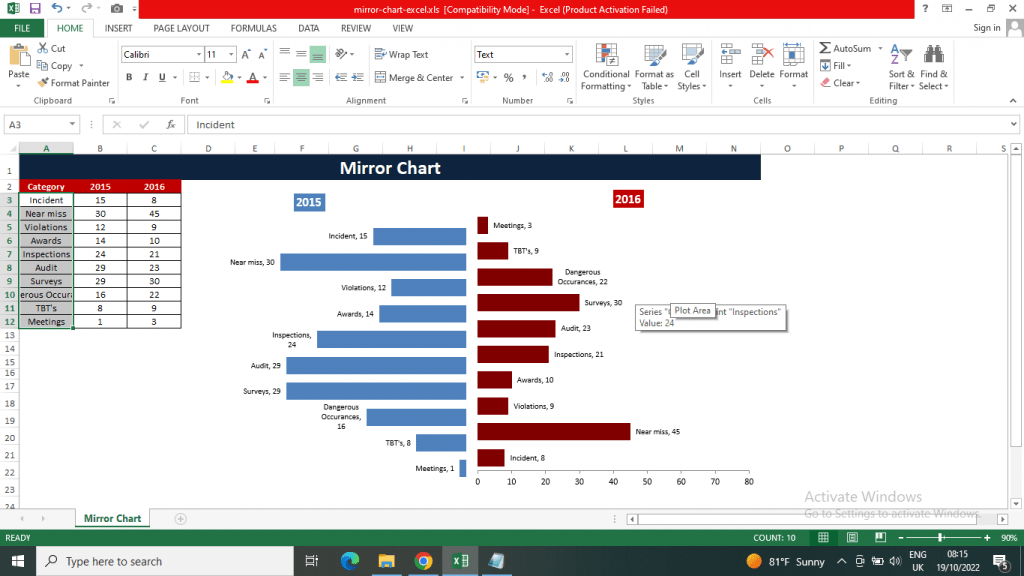
Download HSE Mirror Chart
The Category of HSE Mirror Charts are:
Incident
Near miss
Violations
Awards
Inspections
Audit
Surveys
Dangerous Occurrences
TBT’s
Meetings
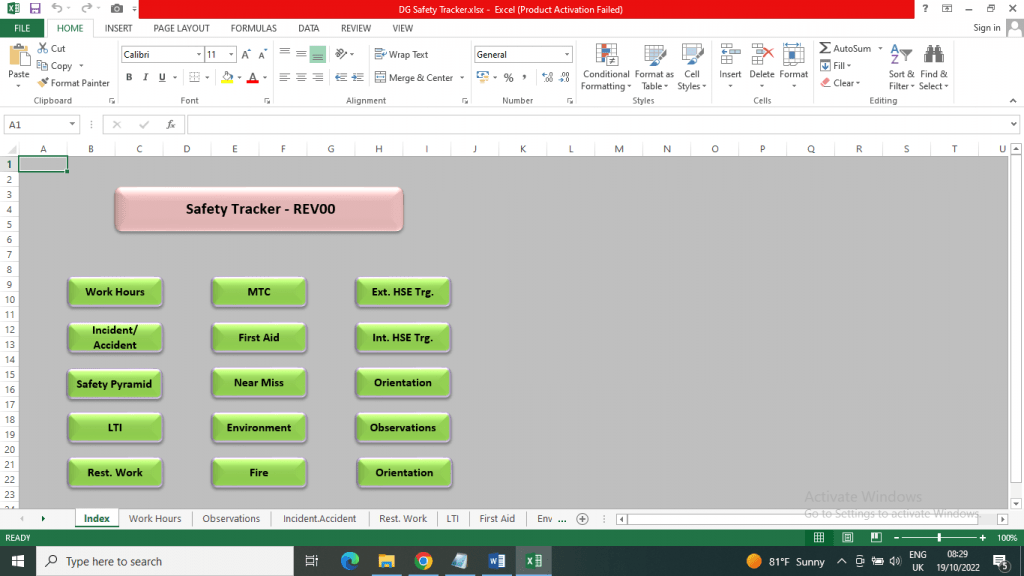
Download HSE Performance Tracker in Excel
The Category of HSE Performance Tracker in Excel are:
Work Hours
Medical Record
External HSE Tanning Record
Incident / Accident Record
First Aid Record
Internal HSE Training Record
Safety Parmid
Near Miss Record
Orientation Record
LTI Record
Environment Record
HSE Observation
Rest Work
Download HSE Performance Tracker in Excel
Download HSE Lagging Indicators Charts in Excel
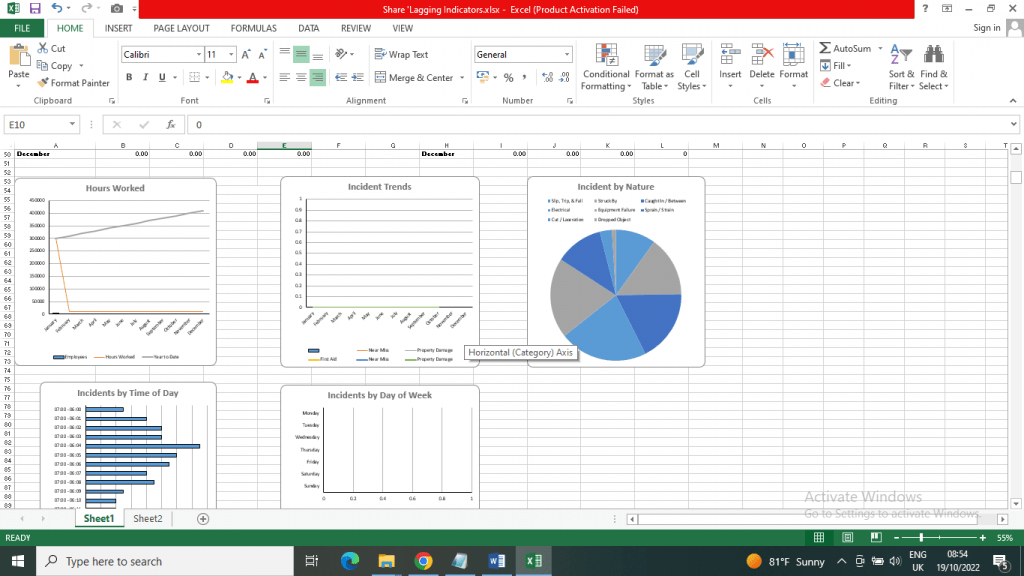
Download HSE Lagging Indicators Charts in Excel
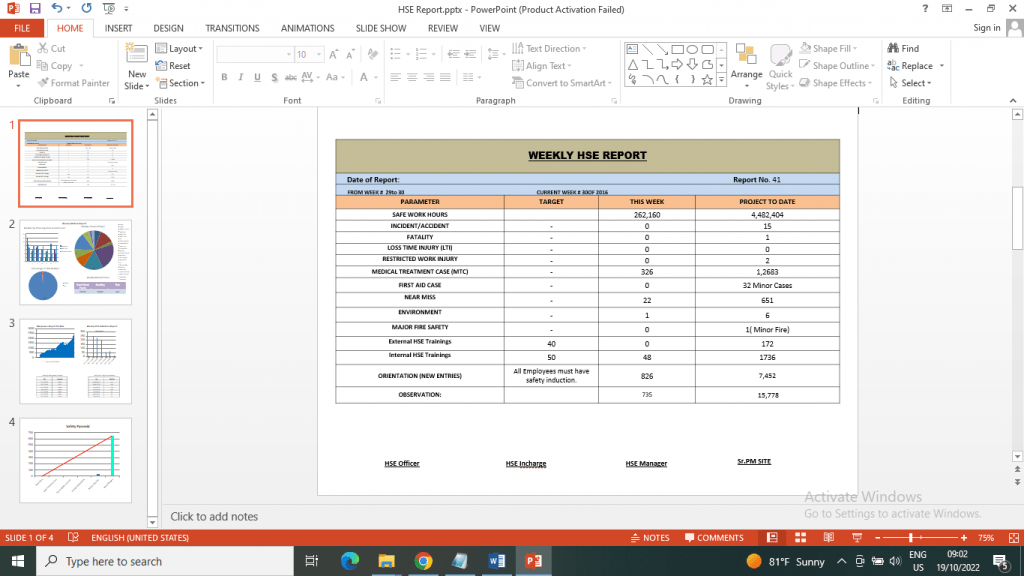
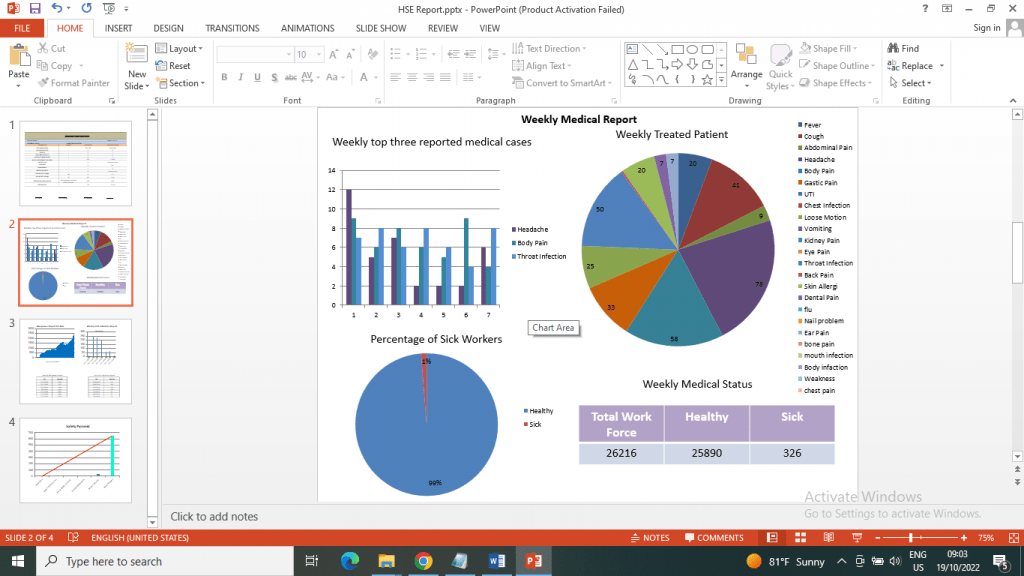
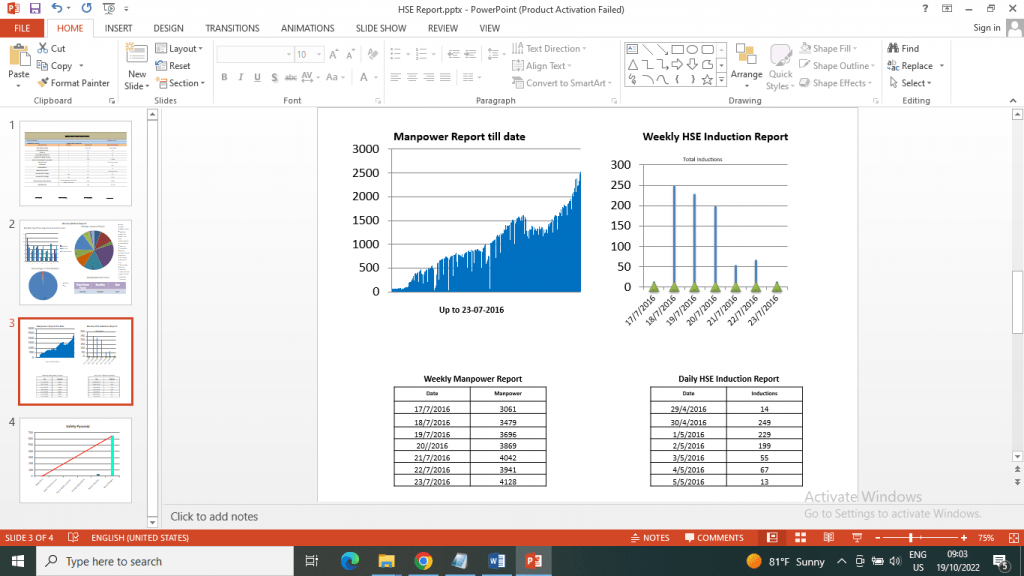
Download HSE Report in Power Point
Parameter for HSE Report are :
Safe work hours
Incident/accident
Fatality
Loss time injury (LTI)
Restricted work injury
Medical treatment case (mtc)
First aid case
Near miss
Environment
Major fire Safety
External HSE trainings
Internal HSE trainings
Orientation (new entries)
HSE Observation
Download HSE Report in Power Point
HSE Leading VS Lagging HSE Report Tool in Excel
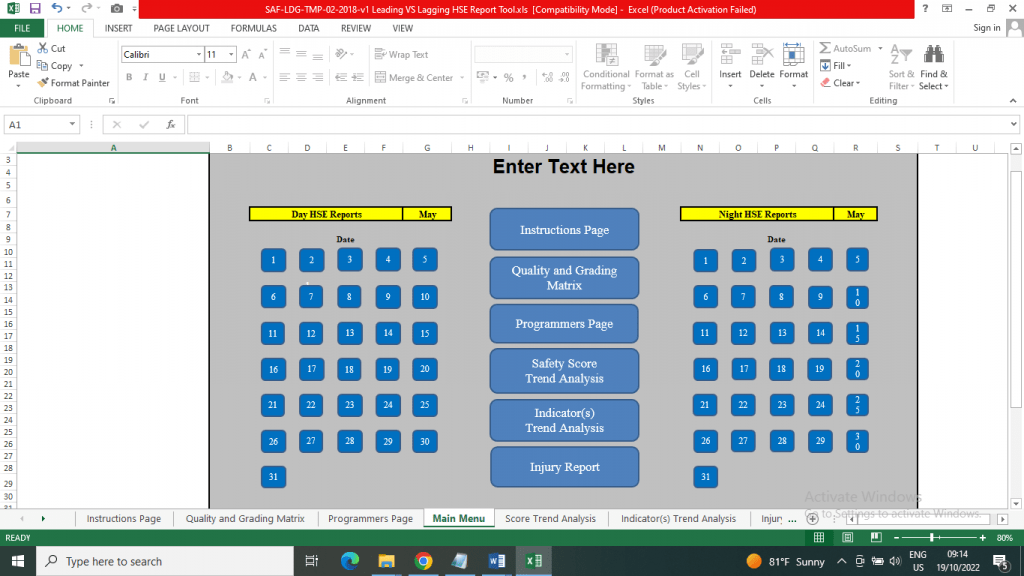
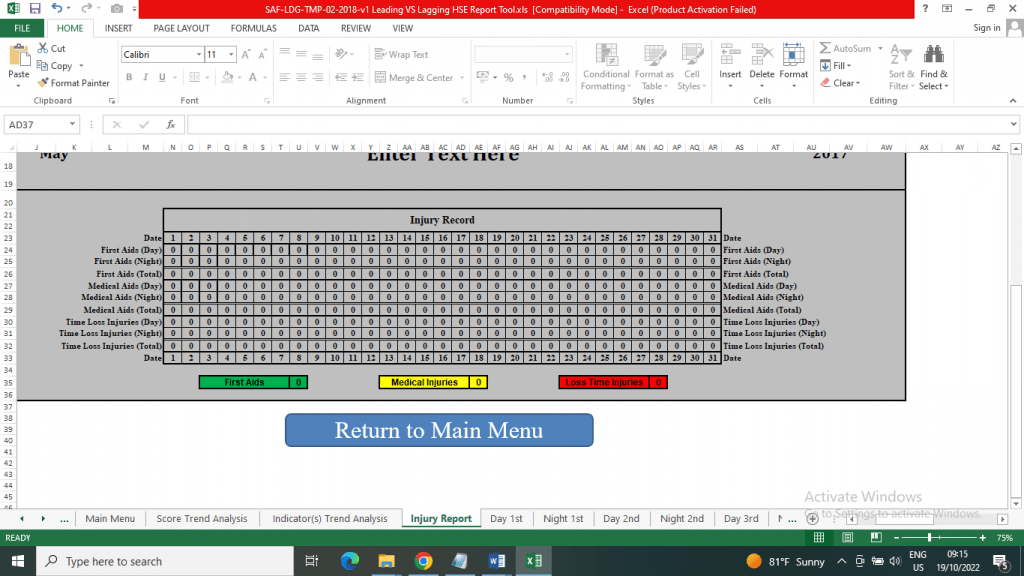
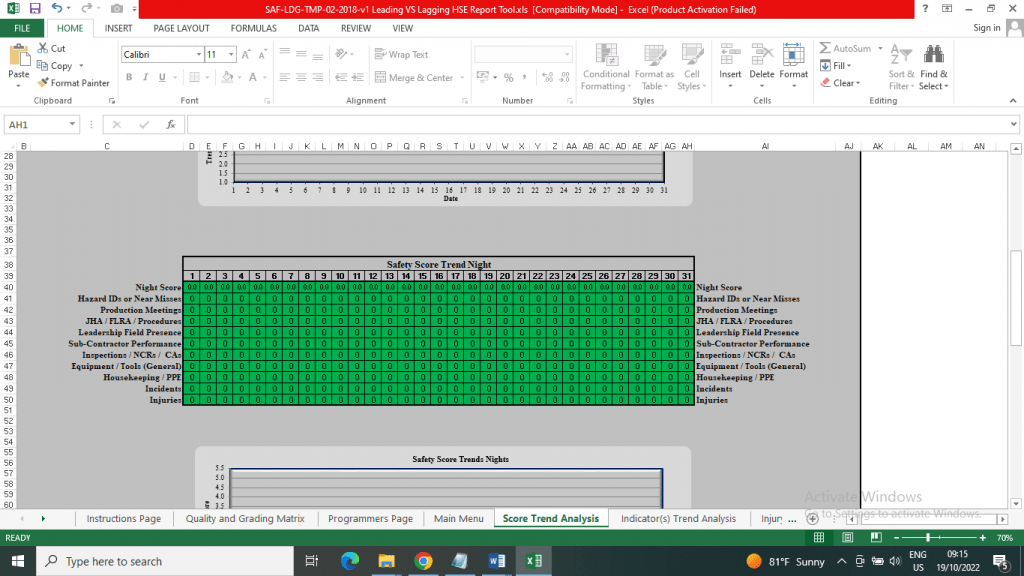
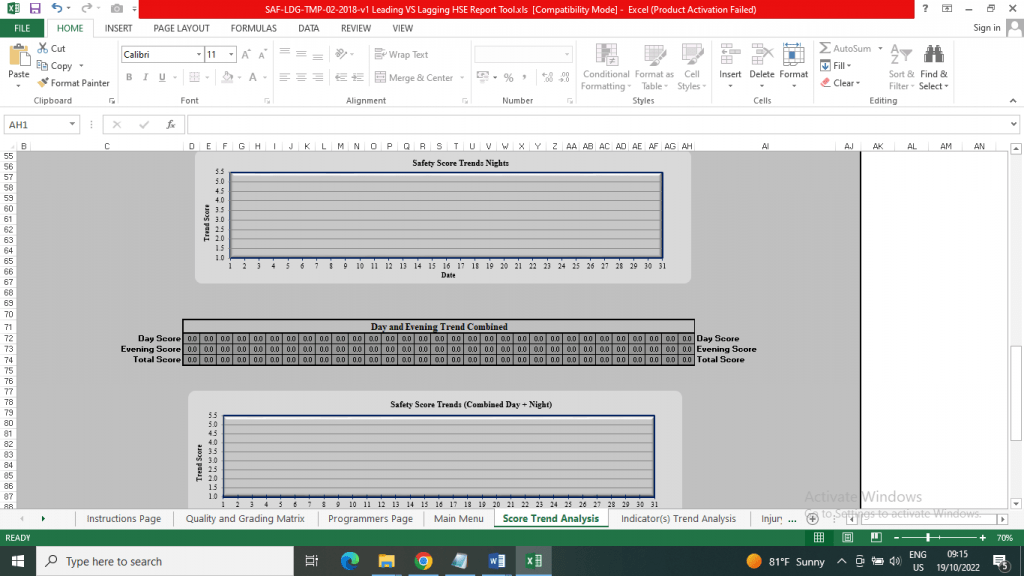
Download HSE Leading VS Lagging HSE Report Tool in Excel
🔰 Share This Post Maximum

Privacy Policy for HSE Docs
Disclaimer
Contact Us
Managed by the LinkedIn HSE Professionals Page, this platform supports safety officers, auditors, and managers worldwide. With a network of 340,000+ professionals, we deliver expertly crafted HSE templates, checklists, and tools to help organizations meet OSHA, ISO, and GCC safety standards.